Energy · Cost · Carbon intelligence

Every meter, every invoice, every tonne of carbon. One screen.

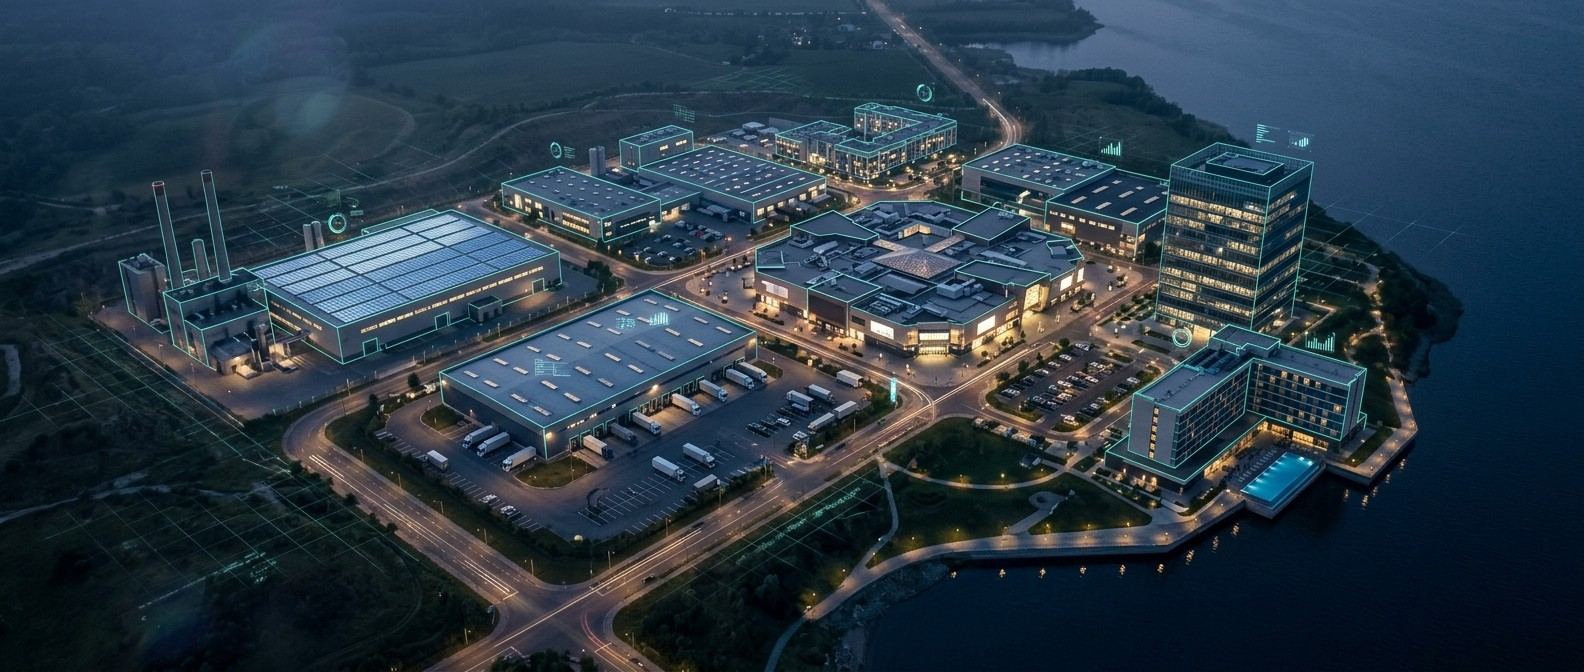
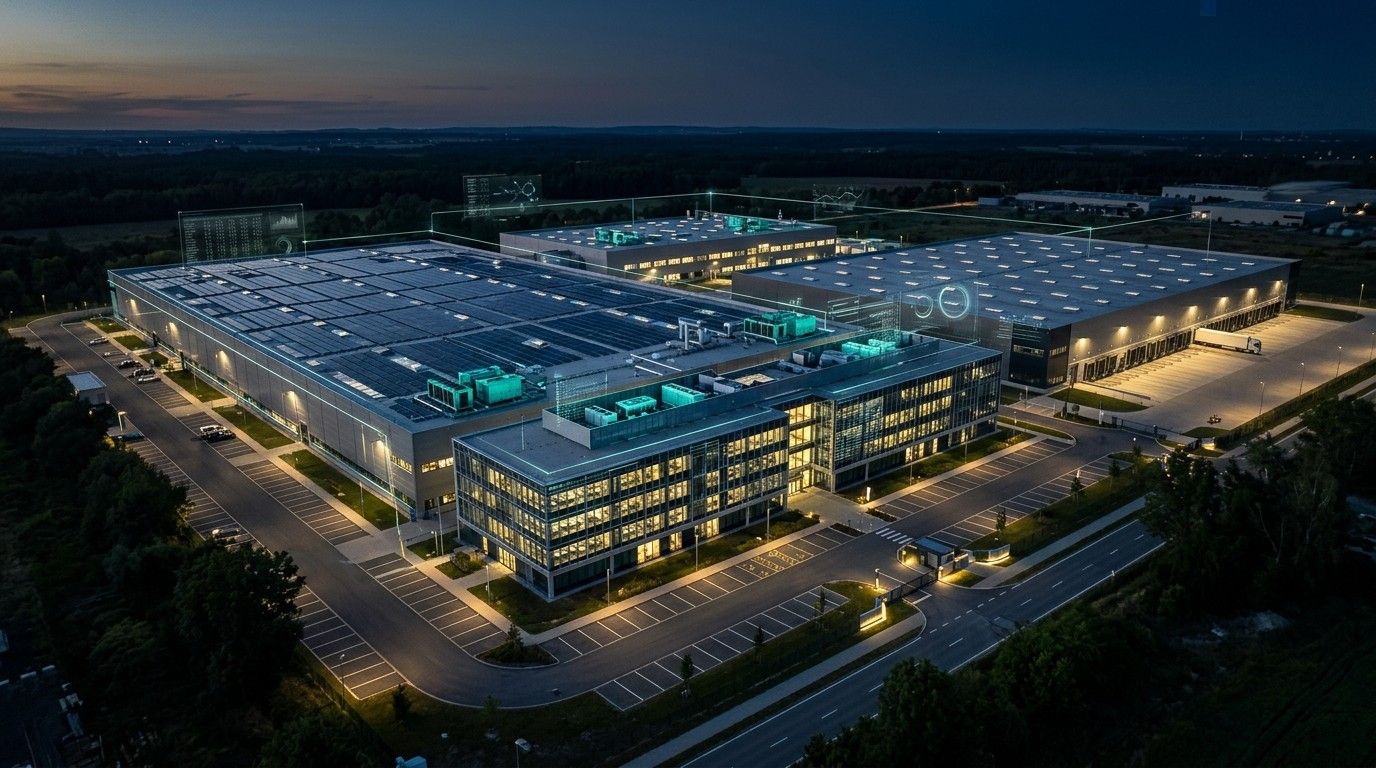
Observer collects scattered energy, operations and emissions data from all your facilities, normalises it by floor area, output and shift, flags deviations instantly and points to where a decision is needed.

Live in 2 weeks Usually no extra hardware Cloud or on-premise
Idle running · BursaCompressor K-02
Saved this month₺312.600
0
Typical first-year energy saving potential
0min
Automatic data interval from meters
0scopes
Scope 1 · 2 · 3 carbon accounting
0hours
Invoice validation time after receipt
Why Observer

Data everywhere, visibility nowhere. Observer closes the gap.

Energy fluctuates with output, shifts, seasons and tariffs. The total invoice hides that dynamic. Observer breaks consumption down by site, equipment and unit and shows exactly where the waste and the overpayment are.

Today
  • Meters are read by hand and merged in Excel
  • Compressor, chiller and furnace loads disappear into one total invoice
  • Billing errors and reactive penalties are noticed at month end, or never
  • Sites can't be compared because output and floor area differ
  • The carbon report is rebuilt from scratch every year, in a different format each time
With Observer
  • Automatic 15-minute data flow from every meter, SCADA and BMS source
  • Sub-meter visibility by equipment and zone; idle-running and night-load alarms
  • Every invoice is checked against metered data and discrepancies are flagged instantly
  • Site benchmarking normalised by floor area, output and shift
  • Scope 1-2-3 emissions calculated continuously from metered data; CBAM and CSRD output in one click
Modules

Three modules, one data layer.

Everything starts with measurement. The same data is served to energy, finance and sustainability teams in their own language.

01 · Energy

Bring every site to its most efficient state.

Tracks equipment, shift and load profiles and normalises them by output and weather. Finds the idling compressor, the night load and the chiller losing efficiency, then produces a prioritised action list.

Anomaly detectionShift analysisDegree-day normalisationSub-meter zonesISO 50001Site score
02 · Cost

Make energy your most visible cost line.

Brings electricity, gas, water and steam spend into one view; validates invoices against metered data, optimises tariffs, prevents reactive penalties and forecasts next month's budget from the production plan.

Invoice validationTariff optimisationReactive penalty preventionBudget forecastCost / unit of output
03 · Carbon

Keep every scope, every source audit-ready.

Gathers emissions data from every department in one place, automates Scope 1-2-3 carbon accounting from metered data and tracks the impact of every reduction project. Produces CBAM, CSRD and CDP reports in one click.

Scope 1 · 2 · 3Emission factor engineCBAM · CSRD · CDP outputReduction project ROIData traceability
Portfolio view

See your portfolio site by site, meter by meter.

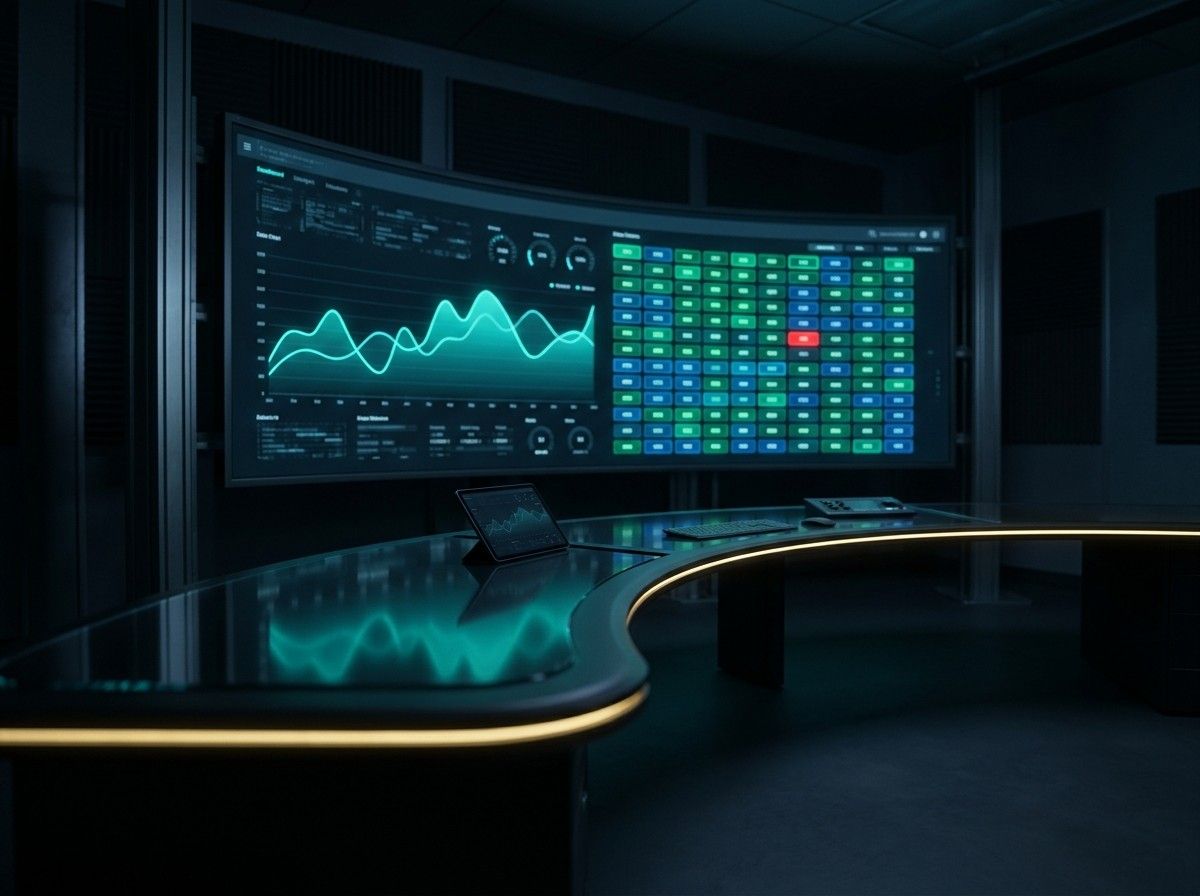
Every measurement point at every site on one screen. Equipment that drifts out of threshold turns red within seconds; the energy team opens a work order with one tap and verifies the result against metered data.

app.observer.eco/portfolio/map
MK
Portfolio /Live mapLIVEMapListAlarms8 sites · 112 points
AllElectricityGasWaterSteamLast 15 min
Measurement point statussite × equipment
On target Low load · standby Anomaly Maintenance
Hover over a measurement pointOpen work order
0
Open anomaliesLive · threshold and profile deviation
0
Measurement points on targetNormalised intensity target
0
Low load / standbyOff-shift, planned
How it works

Connect. Normalise. Improve. Report.

01

Connect

Existing meters, SCADA, BMS, ERP and e-invoice sources are connected within days. Extra hardware is rarely needed.

02

Normalise

Consumption is normalised by floor area, output, shift and degree-day data. Sites, equipment and periods are compared on the same scale.

03

Improve

Suggested actions are ranked by savings impact; the result of each step is verified against metered data and assigned to teams as work orders.

04

Report

ISO 50001, CBAM, CSRD and CDP outputs and management summaries are generated automatically, templated for each stakeholder.

Industries

From a single site to hundreds of branches, for every industry.

Manufacturing

Energy per unit of output, shift and line benchmarking. Idle-running and efficiency-loss detection on compressor, furnace and cooling loads; CBAM-ready carbon.

Logistics and warehousing

Cold storage, conveyor and forklift charging loads in separate zones. Consumption per m² and per pallet; instant alarm on temperature deviation.

Retail and branch networks

Hundreds of stores or branches on one portfolio screen. Store scorecards, opening-hours profiles and automatic invoice validation.

Offices, malls and campuses

HVAC, lighting and tenant sub-meters. Occupancy and degree-day normalisation, tenant cost allocation, building certifications.

Hotels and tourism

Consumption per room-night and per guest; spa, pool and kitchen loads in separate zones. Seasonal profiles and sustainability certification reports.

Finance and services

Branch and data-centre portfolios. Central budgeting, sustainability reporting and auditable carbon data that meets regulatory expectations.

Leadership

Cost and carbon per site in a one-page management summary.

Energy and facility teams

Equipment-level alarms, work orders and maintenance priorities.

Sustainability

Audit-ready Scope 1-2-3 data and reporting templates.

Finance

Validated invoices, budget variance and period forecasts.

Integrations

Speaks to the systems you already have.

Connects to whatever is on site. Not a new infrastructure, an intelligence layer on top of the one you already run.

SCADA / BMSSiemens DesigoSCADA / BMSHoneywellSCADA / BMSSchneider EcoStruxureSCADA / BMSJohnson ControlsBMSKNXBMSBACnetERPSAPERPMicrosoft DynamicsERPLogoMESManufacturing execution systems SCADA / BMSSiemens DesigoSCADA / BMSHoneywellSCADA / BMSSchneider EcoStruxureSCADA / BMSJohnson ControlsBMSKNXBMSBACnetERPSAPERPMicrosoft DynamicsERPLogoMESManufacturing execution systems
MeterModbusMeterM-BusMeterLoRaWANMeterOPC UAMeterDLMS / IEC 62056MeterMQTTInvoicee-InvoiceInvoiceUtility tariffsDataExcel / CSVDataREST APIDataWebhookWeatherDegree-day service MeterModbusMeterM-BusMeterLoRaWANMeterOPC UAMeterDLMS / IEC 62056MeterMQTTInvoicee-InvoiceInvoiceUtility tariffsDataExcel / CSVDataREST APIDataWebhookWeatherDegree-day service
ISO 50001 · Energy ManagementISO 14064GHG ProtocolCBAM · Carbon Border AdjustmentCSRD · ESRSGRICDPSBTiI-RECEN 16247 · Energy Audit
Platform

Enterprise scale, in a language your teams understand.

Smart meters and sub-meters

Clean, unified data from electricity, gas, water, steam and compressed-air meters; breakdown by zone.

Alarms and work orders

Email, SMS and mobile notifications on threshold breach; automatic work orders to the maintenance team.

Mobile app

Live performance, event tracking and work-order closure in the field.

Data gateway

Two-way sync with ERP, production and finance systems; combined analysis with output and revenue data.

Audit-ready reports

Templated per stakeholder, with every figure traceable back to its source.

Cloud or on-premise

GDPR and KVKK compliant; data can stay on your own infrastructure. Role-based access and audit logs.

Demo

Ready to manage energy, cost and carbon together?

Leave your details and our team will get back to you within one business day with a demo built on your own sites' data.

Your details are used only to schedule the demo.
Thank you. Our team will get back to you within one business day.